More Data Transformation

Lecture 5

Published

May 19, 2025

Announcements/Reminders

  • Lab is due TONIGHT at 11:59PM

  • Come to office hours and/or post on Ed for help!

  • Office hours are tonight from 5:30-7:30PM in Old Chem 203.

  • AEs need to be pushed by the END OF CLASS (10:45AM)!!

  • Make sure you are in the right repository.

Lab: Narrative

  • Boxplots, histograms, density plots:

    • Center: Give an idea of a ‘typical value’ (median, most common range, etc.);

    • Spread: Does the data have a lot of variability? Or just a little? (IQR, outliers)

    • Shape: Is there skew? Which direction? Is it unimodal or multimodal?

Lab: Narrative

  • Scatter Plots

    • Is there a relationship between the two variables? Is it positive or negative?

    • If there is a relationship, does it seem to be strong or weak?

    • Is the relationship linear or nonlinear?

Lab: Advice

  • Be Specific in your narrative. Don’t just say “the spread is small and the center is low”. What does that mean??? Give numbers, units (if available), etc.

  • Be Specific in your plot labels.

  • Answer all parts of the question!! Statements like “Compare…” mean to do so in the written answer!

  • Written answers should be text outside of code chunks, not comments

  • Make sure you can render to PDF early!!!

Outline

  • Last Time: Started learning about data transformation!

  • Today:

    • Review from last time + finish AE04

    • More about the pipe

    • Transformation + plotting

Quick Review: Row operations

  • slice(): chooses rows based on location
  • filter(): chooses rows based on column values
  • arrange(): changes the order of the rows
  • sample_n(): take a random subset of the rows
X1 X2 X3
1 a yes
3 b no
5 a yes
7 b yes
9 a yes

Quick Review: Column operations

  • select(): changes whether or not a column is included
  • rename(): changes the name of columns
  • mutate(): changes the values of columns and creates new columns
X1 X2 X3
1 a yes
3 b no
5 a yes
7 b yes
9 a yes

Quick Review: Groups of rows

  • summarize(): collapses a group into a single row
  • count(): count unique values of one or more variables
  • group_by(): perform calculations separately for each value of a variable
X1 X2 X3
1 a yes
3 b no
5 a yes
7 b yes
9 a yes

AE-04

Recap: Group by, summarize, mutate

What does group by do here?

bechdel |>
  group_by(binary) |>
  summarise(mean_roi = mean(roi, na.rm = TRUE), 
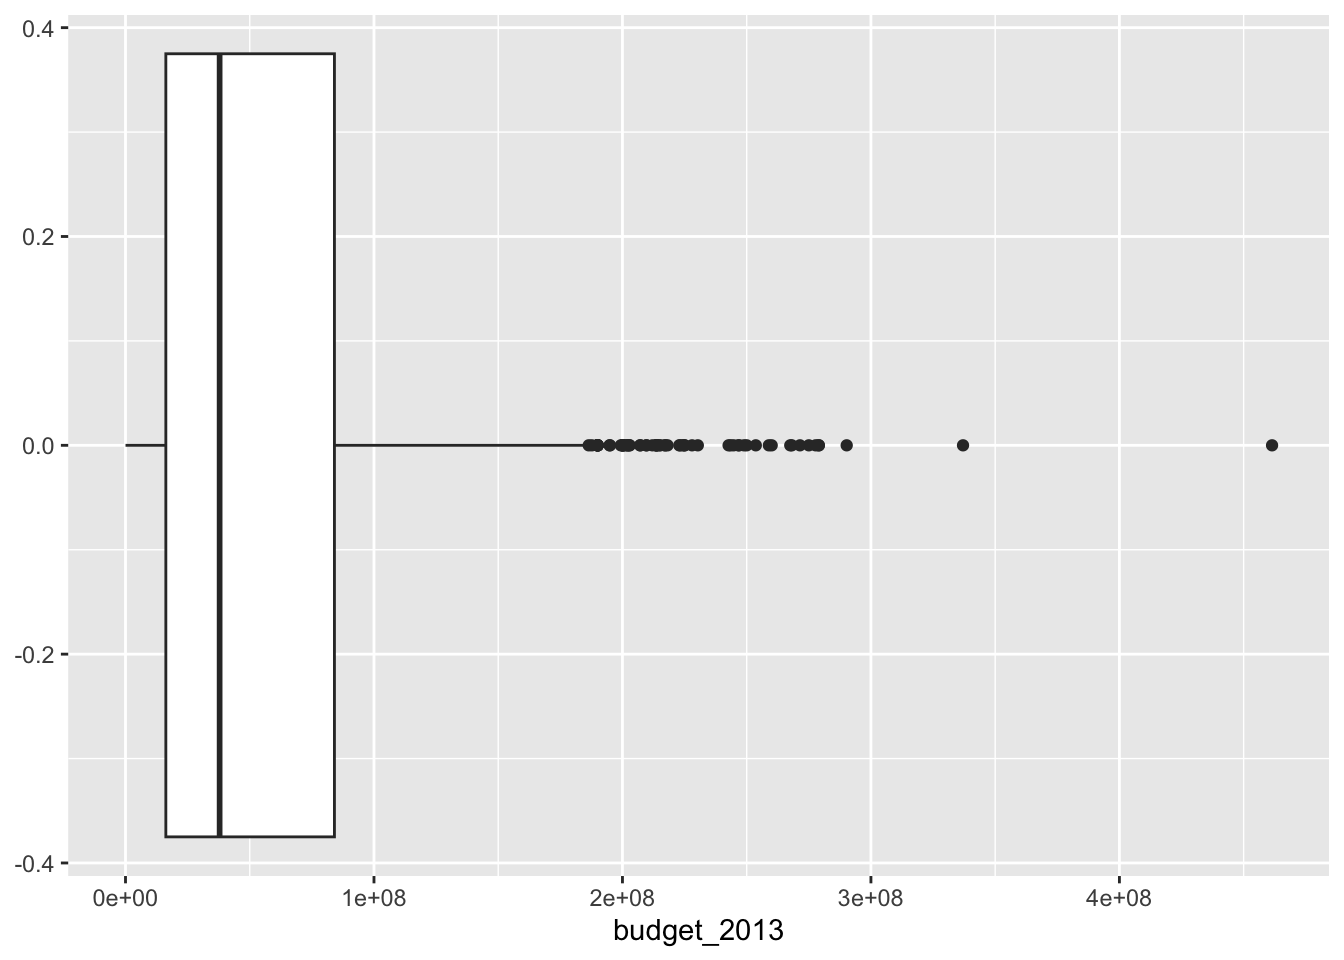
            mean_budget = mean(budget_2013)) 
# A tibble: 2 × 3
  binary mean_roi mean_budget
  <chr>     <dbl>       <dbl>
1 FAIL       8.36   65877024.
2 PASS       7.99   46913086.

Recap: Group by, summarize, mutate

What does group by do here?

bechdel |>
  #group_by(binary) |>
  summarise(mean_roi = mean(roi, na.rm = TRUE), 
            mean_budget = mean(budget_2013)) 
# A tibble: 1 × 2
  mean_roi mean_budget
     <dbl>       <dbl>
1     8.19   57035015.

Recap: Group by, summarize, mutate

What if I change summarize to mutate?

bechdel |>
  group_by(binary) |>
  mutate(mean_roi = mean(roi, na.rm = TRUE), 
            mean_budget = mean(budget_2013)) 
# A tibble: 1,615 × 9
# Groups:   binary [2]
   title          year gross_2013 budget_2013    roi binary clean_test
   <chr>         <dbl>      <dbl>       <dbl>  <dbl> <chr>  <chr>     
 1 21 & Over      2013   67878146    13000000  5.22  FAIL   notalk    
 2 Dredd 3D       2012   55078343    45658735  1.21  PASS   ok        
 3 12 Years a S…  2013  211714070    20000000 10.6   FAIL   notalk    
 4 2 Guns         2013  208105475    61000000  3.41  FAIL   notalk    
 5 42             2013  190040426    40000000  4.75  FAIL   men       
 6 47 Ronin       2013  184166317   225000000  0.819 FAIL   men       
 7 A Good Day t…  2013  371598396    92000000  4.04  FAIL   notalk    
 8 About Time     2013  102648667    12000000  8.55  PASS   ok        
 9 Admission      2013   36014634    13000000  2.77  PASS   ok        
10 After Earth    2013  304895295   130000000  2.35  FAIL   notalk    
# ℹ 1,605 more rows
# ℹ 2 more variables: mean_roi <dbl>, mean_budget <dbl>

Recap: Group by, summarize, mutate

What if I change summarize to mutate?

bechdel |>
  group_by(binary) |>
  mutate(mean_roi = mean(roi, na.rm = TRUE), 
            mean_budget = mean(budget_2013)) |>
  select(title, binary, mean_roi, mean_budget)
# A tibble: 1,615 × 4
# Groups:   binary [2]
   title                  binary mean_roi mean_budget
   <chr>                  <chr>     <dbl>       <dbl>
 1 21 & Over              FAIL       8.36   65877024.
 2 Dredd 3D               PASS       7.99   46913086.
 3 12 Years a Slave       FAIL       8.36   65877024.
 4 2 Guns                 FAIL       8.36   65877024.
 5 42                     FAIL       8.36   65877024.
 6 47 Ronin               FAIL       8.36   65877024.
 7 A Good Day to Die Hard FAIL       8.36   65877024.
 8 About Time             PASS       7.99   46913086.
 9 Admission              PASS       7.99   46913086.
10 After Earth            FAIL       8.36   65877024.
# ℹ 1,605 more rows

Recap: Group by, summarize, mutate

You can group by more than one variable!

bechdel |>
  group_by(binary, year) |>
  summarise(mean_roi = mean(roi, na.rm = TRUE), 
            mean_budget = mean(budget_2013)) 
`summarise()` has grouped output by 'binary'. You can override using
the `.groups` argument.
# A tibble: 48 × 4
# Groups:   binary [2]
   binary  year mean_roi mean_budget
   <chr>  <dbl>    <dbl>       <dbl>
 1 FAIL    1990    13.1    73101991.
 2 FAIL    1991     6.71   74299353 
 3 FAIL    1992    46.3    38883983.
 4 FAIL    1993     6.36   49099374.
 5 FAIL    1994    23.7    57812022.
 6 FAIL    1995     5.69   68251510.
 7 FAIL    1996     3.82   68600475.
 8 FAIL    1997    16.5    73257554.
 9 FAIL    1998     6.95   53083540.
10 FAIL    1999     5.12   72804781.
# ℹ 38 more rows

Recap: Group by, summarize, mutate

You can un group with ungroup()

bechdel |>
  group_by(binary, year) |>
  summarise(mean_roi = mean(roi, na.rm = TRUE), 
            mean_budget = mean(budget_2013)) |>
  ungroup()
`summarise()` has grouped output by 'binary'. You can override using
the `.groups` argument.
# A tibble: 48 × 4
   binary  year mean_roi mean_budget
   <chr>  <dbl>    <dbl>       <dbl>
 1 FAIL    1990    13.1    73101991.
 2 FAIL    1991     6.71   74299353 
 3 FAIL    1992    46.3    38883983.
 4 FAIL    1993     6.36   49099374.
 5 FAIL    1994    23.7    57812022.
 6 FAIL    1995     5.69   68251510.
 7 FAIL    1996     3.82   68600475.
 8 FAIL    1997    16.5    73257554.
 9 FAIL    1998     6.95   53083540.
10 FAIL    1999     5.12   72804781.
# ℹ 38 more rows

More about the pipe

  • The pipe operator passes what comes before it into the function that comes after it as the first argument in that function.
sum(1, 2)
[1] 3


More about the pipe

  • The pipe operator passes what comes before it into the function that comes after it as the first argument in that function.
sum(1, 2)
[1] 3


1 |> 
  sum(2)
[1] 3

Pipe + ggplot() !!

ggplot(bechdel, aes(x = budget_2013)) +
  geom_boxplot()

Pipe + ggplot() !!

bechdel |>
  ggplot(aes(x = budget_2013)) +
  geom_boxplot()

Why is this useful?

  • We can do data transformation immediately followed by a plot!

  • Normally, even if we are just plotting, we use the pipe with ggplot().

Plot + data transform

bechdel
# A tibble: 1,615 × 7
   title          year gross_2013 budget_2013    roi binary clean_test
   <chr>         <dbl>      <dbl>       <dbl>  <dbl> <chr>  <chr>     
 1 21 & Over      2013   67878146    13000000  5.22  FAIL   notalk    
 2 Dredd 3D       2012   55078343    45658735  1.21  PASS   ok        
 3 12 Years a S…  2013  211714070    20000000 10.6   FAIL   notalk    
 4 2 Guns         2013  208105475    61000000  3.41  FAIL   notalk    
 5 42             2013  190040426    40000000  4.75  FAIL   men       
 6 47 Ronin       2013  184166317   225000000  0.819 FAIL   men       
 7 A Good Day t…  2013  371598396    92000000  4.04  FAIL   notalk    
 8 About Time     2013  102648667    12000000  8.55  PASS   ok        
 9 Admission      2013   36014634    13000000  2.77  PASS   ok        
10 After Earth    2013  304895295   130000000  2.35  FAIL   notalk    
# ℹ 1,605 more rows

Plot + data transform

bechdel |>
  mutate(budget_in_millions = budget_2013/1000000)
# A tibble: 1,615 × 8
   title          year gross_2013 budget_2013    roi binary clean_test
   <chr>         <dbl>      <dbl>       <dbl>  <dbl> <chr>  <chr>     
 1 21 & Over      2013   67878146    13000000  5.22  FAIL   notalk    
 2 Dredd 3D       2012   55078343    45658735  1.21  PASS   ok        
 3 12 Years a S…  2013  211714070    20000000 10.6   FAIL   notalk    
 4 2 Guns         2013  208105475    61000000  3.41  FAIL   notalk    
 5 42             2013  190040426    40000000  4.75  FAIL   men       
 6 47 Ronin       2013  184166317   225000000  0.819 FAIL   men       
 7 A Good Day t…  2013  371598396    92000000  4.04  FAIL   notalk    
 8 About Time     2013  102648667    12000000  8.55  PASS   ok        
 9 Admission      2013   36014634    13000000  2.77  PASS   ok        
10 After Earth    2013  304895295   130000000  2.35  FAIL   notalk    
# ℹ 1,605 more rows
# ℹ 1 more variable: budget_in_millions <dbl>

Plot + data transform

bechdel |>
  mutate(budget_in_millions = budget_2013/1000000) |>
  ggplot(aes(x = budget_in_millions))

Exploratory Data Analysis

What is exploratory data analysis (EDA)??

  • Basically everything we have done so far

  • Making plots and computing summary statistics (proportions, means, IQR, etc.) to help explore the data

AE 05

Image source

Assignment

Let’s make a tiny data frame to use as an example:

library(tidyverse)
df <- tibble(x = c(1, 2, 3, 4, 5), y = c("a", "a", "b", "c", "c"))
df
# A tibble: 5 × 2
      x y    
  <dbl> <chr>
1     1 a    
2     2 a    
3     3 b    
4     4 c    
5     5 c    

Assignment

Do something and show me

df |>
  mutate(x = x * 2)
# A tibble: 5 × 2
      x y    
  <dbl> <chr>
1     2 a    
2     4 a    
3     6 b    
4     8 c    
5    10 c    
df
# A tibble: 5 × 2
      x y    
  <dbl> <chr>
1     1 a    
2     2 a    
3     3 b    
4     4 c    
5     5 c    

Do something and save result

df <- df |>
  mutate(x = x * 2)
df
# A tibble: 5 × 2
      x y    
  <dbl> <chr>
1     2 a    
2     4 a    
3     6 b    
4     8 c    
5    10 c    

Assignment

Do something, save result, overwriting original

df <- tibble(
  x = c(1, 2, 3, 4, 5), 
  y = c("a", "a", "b", "c", "c")
)
df <- df |>
  mutate(x = x * 2)
df
# A tibble: 5 × 2
      x y    
  <dbl> <chr>
1     2 a    
2     4 a    
3     6 b    
4     8 c    
5    10 c    

Do something, save result, not overwriting original

df <- tibble(
  x = c(1, 2, 3, 4, 5), 
  y = c("a", "a", "b", "c", "c")
)
df_new <- df |>
  mutate(x = x * 2)
df_new
# A tibble: 5 × 2
      x y    
  <dbl> <chr>
1     2 a    
2     4 a    
3     6 b    
4     8 c    
5    10 c    

Assignment

Do something, save result, overwriting original when you shouldn’t

df <- tibble(
  x = c(1, 2, 3, 4, 5), 
  y = c("a", "a", "b", "c", "c")
)
df <- df |>
  group_by(y) |>
  summarize(mean_x = mean(x))
df
# A tibble: 3 × 2
  y     mean_x
  <chr>  <dbl>
1 a        1.5
2 b        3  
3 c        4.5

Do something, save result, not overwriting original when you shouldn’t

df <- tibble(
  x = c(1, 2, 3, 4, 5), 
  y = c("a", "a", "b", "c", "c")
)
df_summary <- df |>
  group_by(y) |>
  summarize(mean_x = mean(x))
df_summary
# A tibble: 3 × 2
  y     mean_x
  <chr>  <dbl>
1 a        1.5
2 b        3  
3 c        4.5

Assignment

Do something, save result, overwriting original
data frame

df <- tibble(
  x = c(1, 2, 3, 4, 5), 
  y = c("a", "a", "b", "c", "c")
)
df <- df |>
  mutate(z = x + 2)
df
# A tibble: 5 × 3
      x y         z
  <dbl> <chr> <dbl>
1     1 a         3
2     2 a         4
3     3 b         5
4     4 c         6
5     5 c         7

Do something, save result, overwriting original
column

df <- tibble(
  x = c(1, 2, 3, 4, 5), 
  y = c("a", "a", "b", "c", "c")
)
df <- df |>
  mutate(x = x + 2)
df
# A tibble: 5 × 2
      x y    
  <dbl> <chr>
1     3 a    
2     4 a    
3     5 b    
4     6 c    
5     7 c