AE 12: Modelling penguins
Suggested answers
In this application exercise we will be studying penguins. The data can be found in the palmerpenguins package and we will use tidyverse and tidymodels for data exploration and modeling, respectively.
You’ve seen the penguins data far too much at this point (sorry!!!), but we’re going to bring it back one more time.
glimpse(penguins)Rows: 344
Columns: 8
$ species <fct> Adelie, Adelie, Adelie, Adelie, Adelie, Adelie, Adel…
$ island <fct> Torgersen, Torgersen, Torgersen, Torgersen, Torgerse…
$ bill_length_mm <dbl> 39.1, 39.5, 40.3, NA, 36.7, 39.3, 38.9, 39.2, 34.1, …
$ bill_depth_mm <dbl> 18.7, 17.4, 18.0, NA, 19.3, 20.6, 17.8, 19.6, 18.1, …
$ flipper_length_mm <int> 181, 186, 195, NA, 193, 190, 181, 195, 193, 190, 186…
$ body_mass_g <int> 3750, 3800, 3250, NA, 3450, 3650, 3625, 4675, 3475, …
$ sex <fct> male, female, female, NA, female, male, female, male…
$ year <int> 2007, 2007, 2007, 2007, 2007, 2007, 2007, 2007, 2007…Part 1
Our goal is to understand better how various body measurements and attributes of penguins relate to their body mass. First, we are going to investigate the relationship between a penguins’ flipper lengths and their body masses.
- Based on our research focus, body mass is the response variable.
Task 1 - Exploratory Data Analysis: Visualize the relationship between flipper length and body mass of penguins.
ggplot(penguins, aes(x = flipper_length_mm, y = body_mass_g)) +
  geom_point()
Warning: Removed 2 rows containing missing values or values outside the scale range
(`geom_point()`).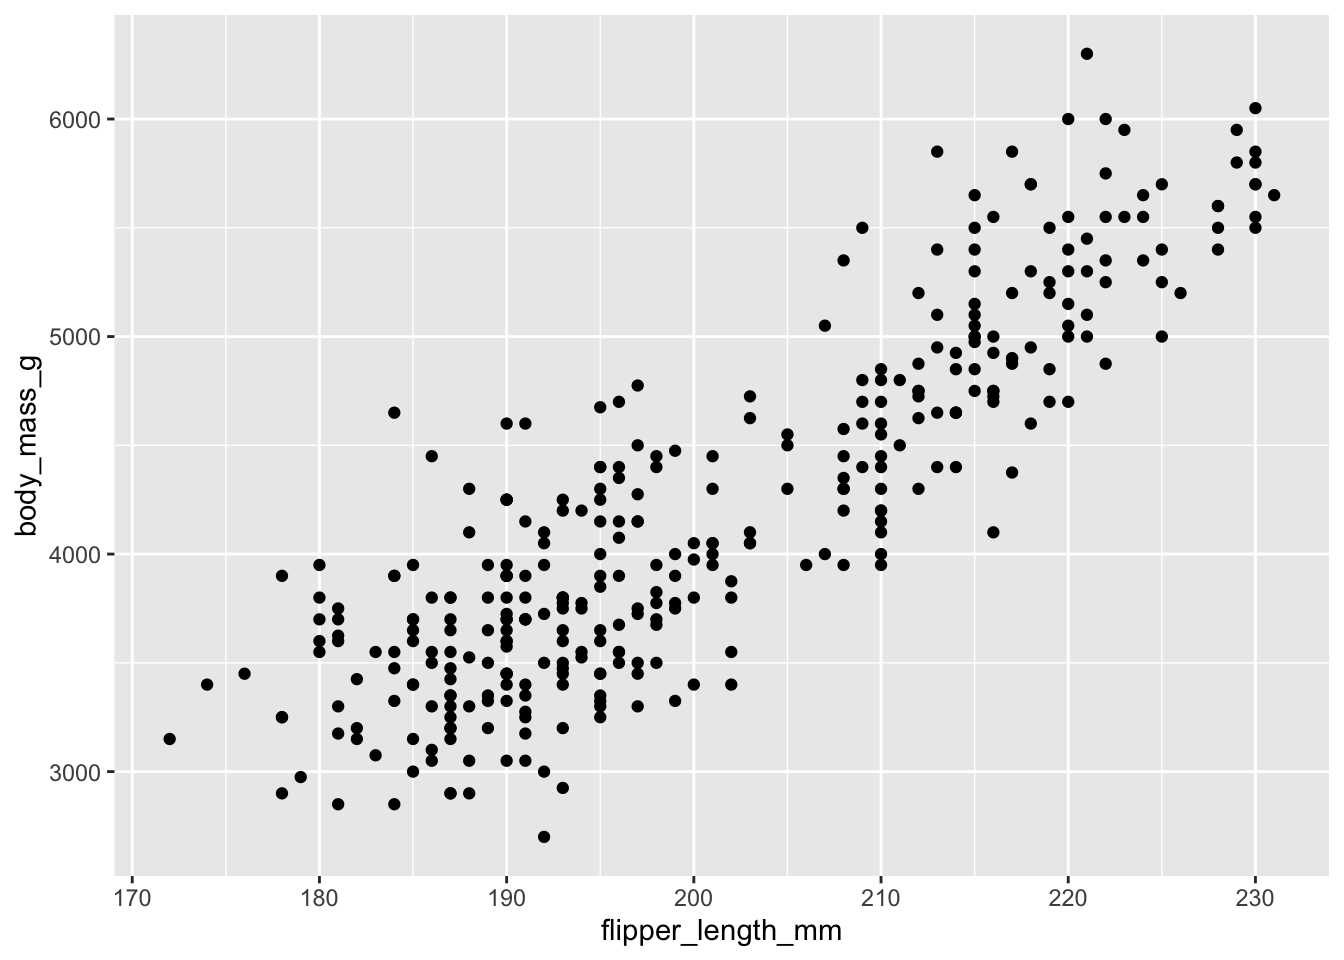
Correlation
Task 2 - Complete the following
-
Question: What is correlation? What values can correlation take?
Strength and direction of a linear relationship. It’s bounded by -1 and 1.
NoteAre you good at guessing correlation? Give it a try with this game!
Code: What is the correlation between flipper length and body mass of penguins?
Defining, fitting, and summarizing a model
Task 3 (Demo) : Write the population model (model for the true values) below that explains the relationship between body mass and flipper length.
\[ {body mass} = \beta_0 + \beta_1 \times flipper length + \epsilon \]Task 4: Fit the linear regression model and display the results. Write the estimated model output below!
bm_fl_fit <- linear_reg() |>
  fit(body_mass_g ~ flipper_length_mm, data = penguins)

tidy(bm_fl_fit)
# A tibble: 2 × 5
term estimate std.error statistic p.value
<chr> <dbl> <dbl> <dbl> <dbl>
1 (Intercept) -5781. 306. -18.9 5.59e- 55
2 flipper_length_mm 49.7 1.52 32.7 4.37e-107\[ \widehat{body mass} = -5780 + 49.7 \times flipper length \]
Task 5: Interpret the slope and the intercept in the context of the data.
Intercept: Penguins with 0 flipper length are expected, on average, to weigh -5,781 grams.
Slope: For each additional millimeter of a penguin;s flipper length, the weight of their penguin is expected to be higher, on average, by 49.7 grams.
Task 6: Recreate the visualization from above, this time adding a regression line to the visualization geom_smooth(method = "lm").
ggplot(
  penguins,
  aes(x = flipper_length_mm, y = body_mass_g)
  ) +
  geom_point() +
  geom_smooth(method = "lm")
`geom_smooth()` using formula = 'y ~ x'Warning: Removed 2 rows containing non-finite outside the scale range
(`stat_smooth()`).Warning: Removed 2 rows containing missing values or values outside the scale range
(`geom_point()`).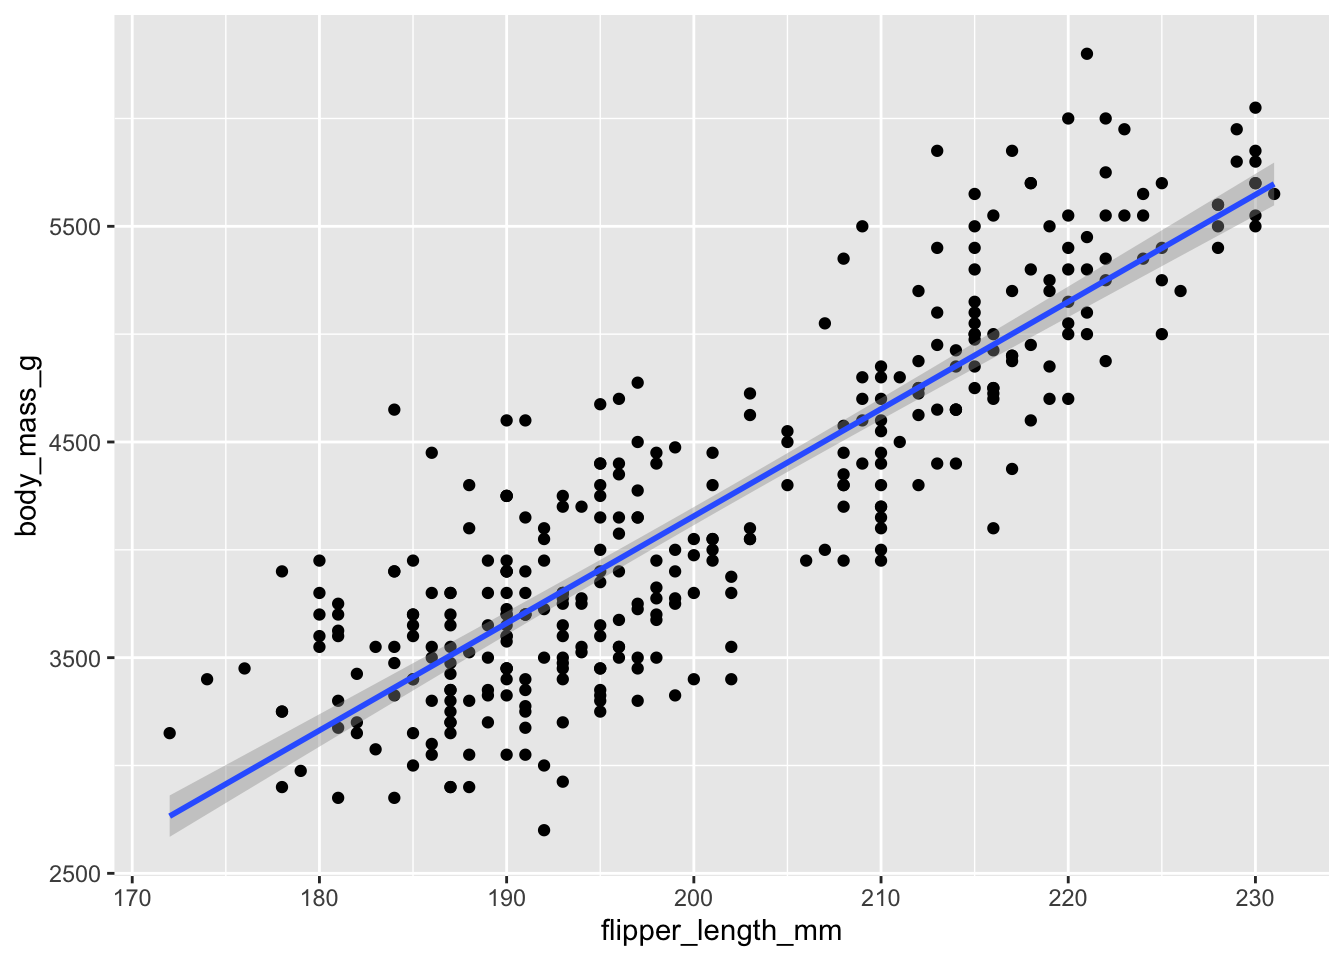
Task 7 (Demo): What is the estimated body mass for a penguin with a flipper length of 210?
penguin_flipper_210 <- tibble(flipper_length_mm = 210)

bm_fl_fit |>
  predict(new_data = penguin_flipper_210)
# A tibble: 1 × 1
.pred
<dbl>
1 4653.Task 8: What is the estimated body mass for a penguin with a flipper length of 100? Add code to find it! Is there anything weird about making this prediction?
penguin_flipper_100 <- tibble(flipper_length_mm = 100)

bm_fl_fit |>
  predict(new_data = penguin_flipper_100)
# A tibble: 1 × 1
.pred
<dbl>
1 -812.We are extrapolating when we take flipper length = 100: it is outside of the data range.
Part 2: Another model
Task 9: A different researcher wants to look at body weight of penguins based on the island they were recorded on.
-
Question: How are the variables involved in this analysis different?
The predictor variable is categorical, not quantitative!
Code: Make an appropriate visualization to investigate this relationship below. Additionally, calculate the mean body mass by island.
penguins |>
  ggplot(aes(x = island, y = body_mass_g)) +
  geom_boxplot()
Warning: Removed 2 rows containing non-finite outside the scale range
(`stat_boxplot()`).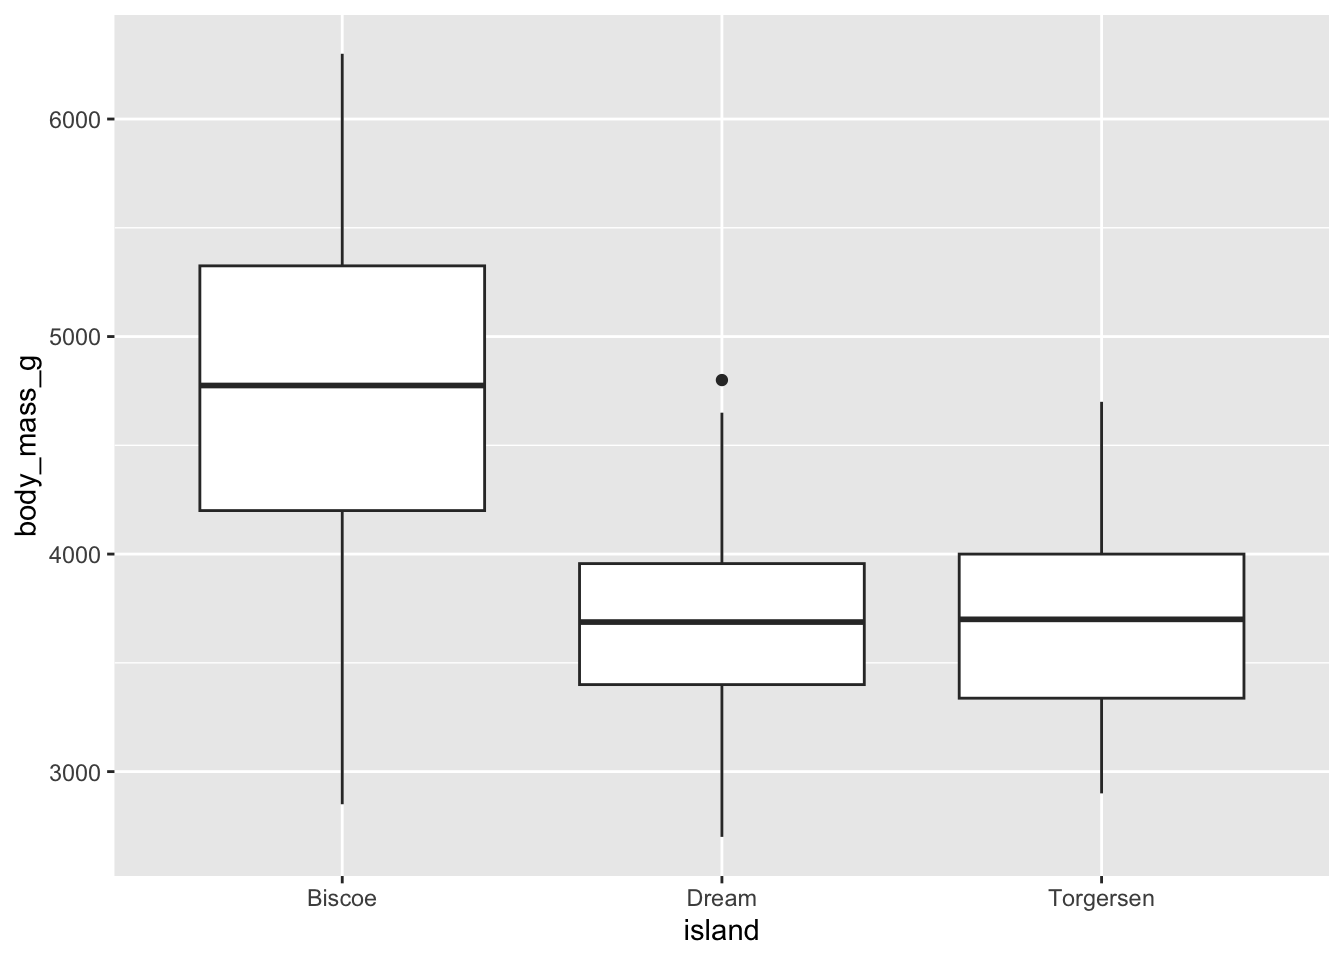
# A tibble: 3 × 2
  island    mean_bm
  <fct>       <dbl>
1 Biscoe      4716.
2 Dream       3713.
3 Torgersen   3706.
Task 10: Change the geom of your previous plot to geom_point(). Use this plot to think about how R models these data.
penguins |>
  ggplot(aes(x = island, y = body_mass_g)) +
  geom_point()
Warning: Removed 2 rows containing missing values or values outside the scale range
(`geom_point()`).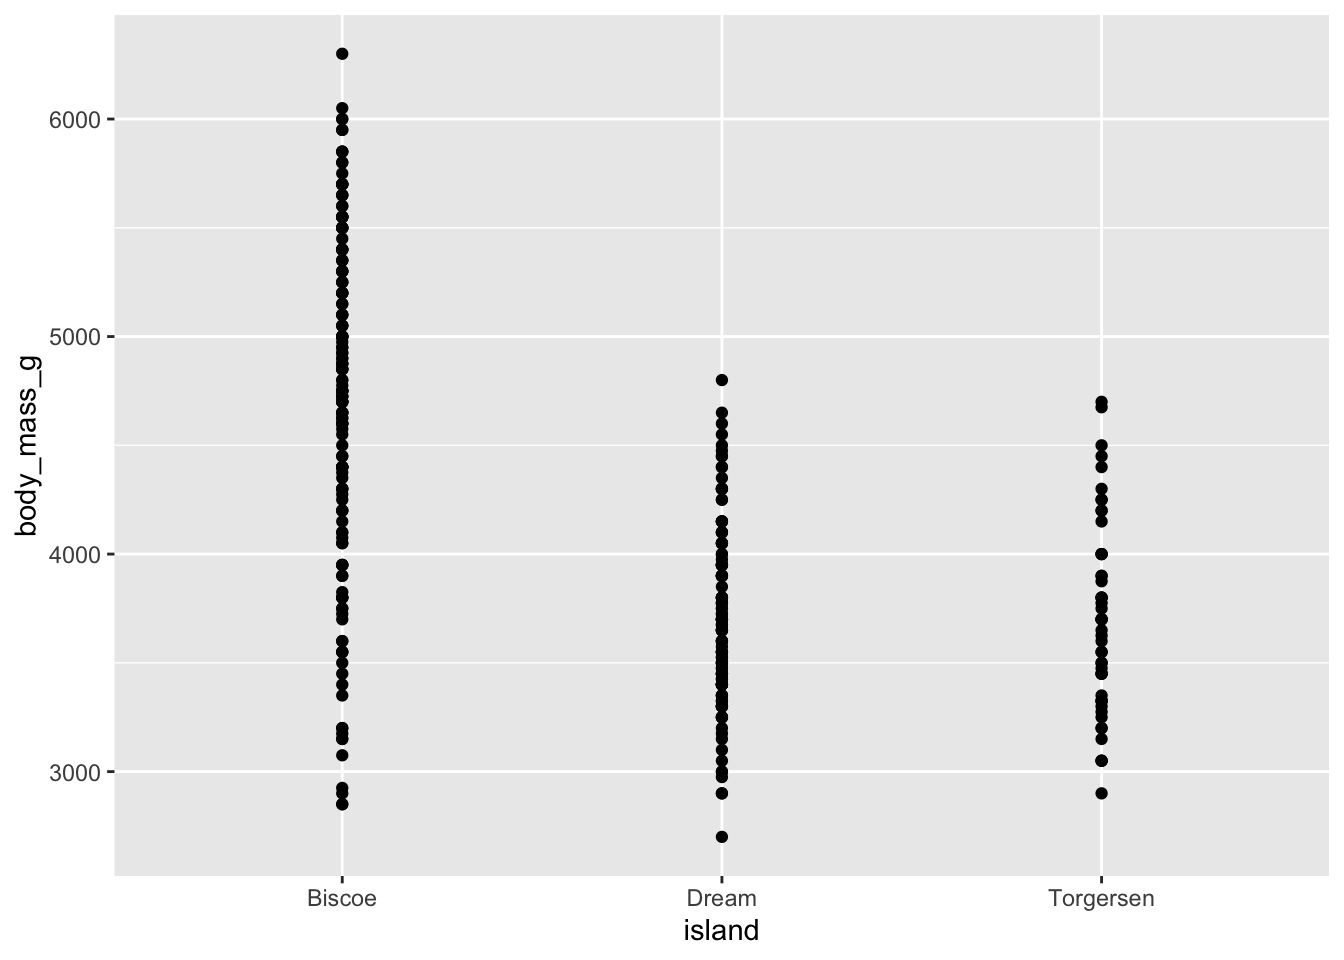
Task 11: Fit the linear regression model and display the results. Write the estimated model output below.
bm_island_fit <- linear_reg() |>
  fit(body_mass_g ~ island, data = penguins)

tidy(bm_island_fit)
# A tibble: 3 × 5
term estimate std.error statistic p.value
<chr> <dbl> <dbl> <dbl> <dbl>
1 (Intercept) 4716. 48.5 97.3 8.93e-250
2 islandDream -1003. 74.2 -13.5 1.42e- 33
3 islandTorgersen -1010. 100. -10.1 4.66e- 21\[ \widehat{bodymass} = 4716 -1003 \times dream -1010 \times torgersen \]
Interpreting Categorical Predictors
Task 12: Fill in the blanks.
- The baseline island is Biscoe.
- Intercept: Penguins from Biscoe island are expected to weigh, on average, 4716 grams.
- Slopes:
Penguins from Dream are expected to weigh, on average, 1003 grams less than those from Biscoe.
Penguins from Torgersen island are expected to weigh, on average, 1010 grams less than those from Biscoe.
Task 13: What is the estimated body weight of a penguin on Biscoe island? What are the estimated body weights of penguins on Dream and Torgersen islands?