AE 03: Duke Forest
Suggested answers
Packages
Data
We will be using the Duke forest data set in the open intro package.
Do your own investigation to get to know the data. How many observations does it have? How many variables are measured? Go ahead and do a glimpse!
glimpse(duke_forest)Rows: 98
Columns: 13
$ address <chr> "1 Learned Pl, Durham, NC 27705", "1616 Pinecrest Rd, Durha…
$ price <dbl> 1520000, 1030000, 420000, 680000, 428500, 456000, 1270000, …
$ bed <dbl> 3, 5, 2, 4, 4, 3, 5, 4, 4, 3, 4, 4, 3, 5, 4, 5, 3, 4, 4, 3,…
$ bath <dbl> 4.0, 4.0, 3.0, 3.0, 3.0, 3.0, 5.0, 3.0, 5.0, 2.0, 3.0, 3.0,…
$ area <dbl> 6040, 4475, 1745, 2091, 1772, 1950, 3909, 2841, 3924, 2173,…
$ type <chr> "Single Family", "Single Family", "Single Family", "Single …
$ year_built <dbl> 1972, 1969, 1959, 1961, 2020, 2014, 1968, 1973, 1972, 1964,…
$ heating <chr> "Other, Gas", "Forced air, Gas", "Forced air, Gas", "Heat p…
$ cooling <fct> central, central, central, central, central, central, centr…
$ parking <chr> "0 spaces", "Carport, Covered", "Garage - Attached, Covered…
$ lot <dbl> 0.97, 1.38, 0.51, 0.84, 0.16, 0.45, 0.94, 0.79, 0.53, 0.73,…
$ hoa <chr> NA, NA, NA, NA, NA, NA, NA, NA, NA, NA, NA, NA, NA, NA, NA,…
$ url <chr> "https://www.zillow.com/homedetails/1-Learned-Pl-Durham-NC-…Data Preparation
One of the questions in this AE asks about garages - notice that this is not a variable in the data set. I am adding code that creates a categorical variable called garage that has two levels: Garage or No garage. Our new variable equals "Garage" if the word "Garage" is detected in the parking variable and equals "No garage" if not.
You do not need to understand this code yet - we will learn how to write things like this in the coming days! For now, just run the code!
duke_forest = duke_forest |>
  mutate(garage = if_else(str_detect(parking, "Garage"),   "Garage", "No garage"))
What did this do?
Go ahead and look at the data again to see the change.
Excercise 1
Suppose you’re helping some family friends who are looking to buy a house in Duke Forest.
As they browse Zillow listings, they realize some houses have garages and others don’t, and they wonder: **Does having a garage make a difference?* *
Luckily, you can help them answer this question with data visualization!
- Make histograms of the prices of houses in Duke Forest based on whether they have a garage.
- Then, facet by `garage` and use different colors for the two facets.
- Choose an appropriate binwidth and decide whether a legend is needed, and turn it off if not.
- Include informative title and axis labels.
- Finally, include a brief (2-3 sentence) narrative comparing the distributions of prices of Duke Forest houses that do and don’t have garages. Your narrative should touch on whe
duke_forest |>
  mutate(garage = if_else(str_detect(parking, "Garage"), "Garage", "No garage")) |>
  ggplot(aes(x = price, fill = garage)) +
  geom_histogram() +
  facet_wrap(~garage, ncol = 1) +
  labs(
    x = "Price in $",
    y = "",
    title = "Histogram of Price of Homes by Garage or not",
    fill = "Garage or not"
  )
`stat_bin()` using `bins = 30`. Pick better value with `binwidth`.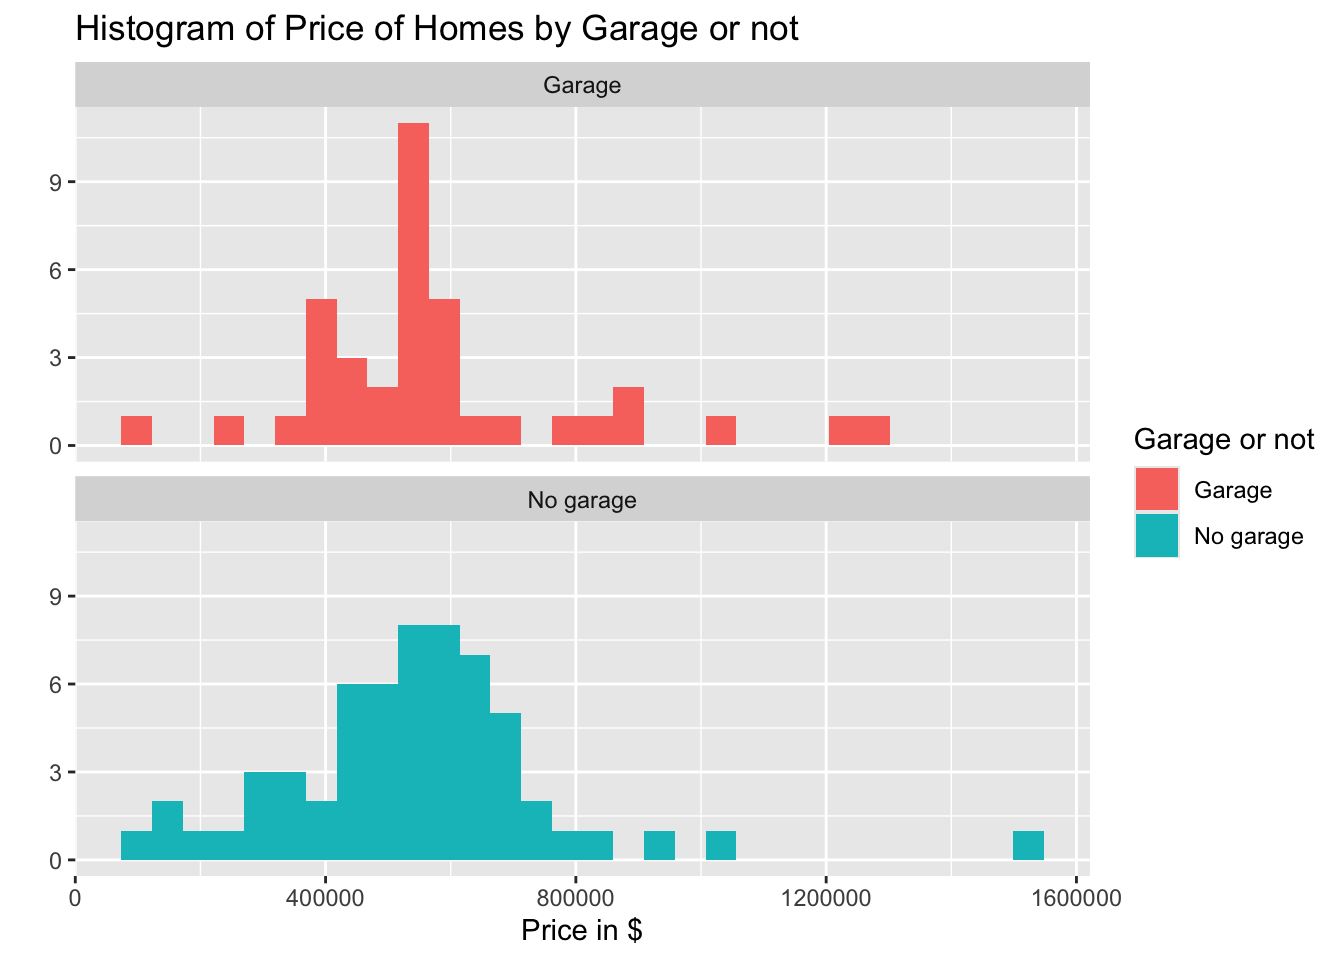
Note: ncol = 1 is not necessary here, but it makes the facet 1 column instead of 1 row, which I think helps with readability!
The distributions of prices of houses with and without garages are fairly similar, with centers around $600,000. Each distribution has potential outliers on the higher end. Based on this visualization, having a garage does not appear to “make a difference”.
Exercise 2
It’s expected that within any given market, larger houses will be priced higher. It’s also expected that the age of the house will have an effect on the price. However in some markets new houses might be more expensive while in others new construction might mean “no character” and hence be less expensive. So your family friends ask: “In Duke Forest, do houses that are bigger and more expensive tend to be newer ones than those that are smaller and cheaper?”
Once again, data visualization skills to the rescue!
- Create a scatter plot to exploring the relationship between
priceandarea, conditioning foryear_built. - Use
geom_smooth()with the argumentse = FALSEto add a smooth curve fit to the data and color the points byyear_built. - Include informative title, axis, and legend labels.
- Discuss each of the following claims (1-2 sentences per claim). Your discussion should touch on specific things you observe in your plot as evidence for or against the claims.
- Claim 1: Larger houses are priced higher.
- Claim 2: Newer houses are priced higher.
- Claim 3: Bigger and more expensive houses tend to be newer ones than smaller and cheaper ones.
ggplot(
  duke_forest,
  aes(x = area, y = price, color = year_built)
) +
  geom_point(size = 3) +
  geom_smooth(se = FALSE) +
  labs(
    x = "Area of Home",
    y = "Price of Home",
    title = "Relationship between Price and Area by Year Built",
    color = "Year Built"
  )
`geom_smooth()` using method = 'loess' and formula = 'y ~ x'Warning: The following aesthetics were dropped during statistical transformation:
colour.
ℹ This can happen when ggplot fails to infer the correct grouping structure in
the data.
ℹ Did you forget to specify a `group` aesthetic or to convert a numerical
variable into a factor?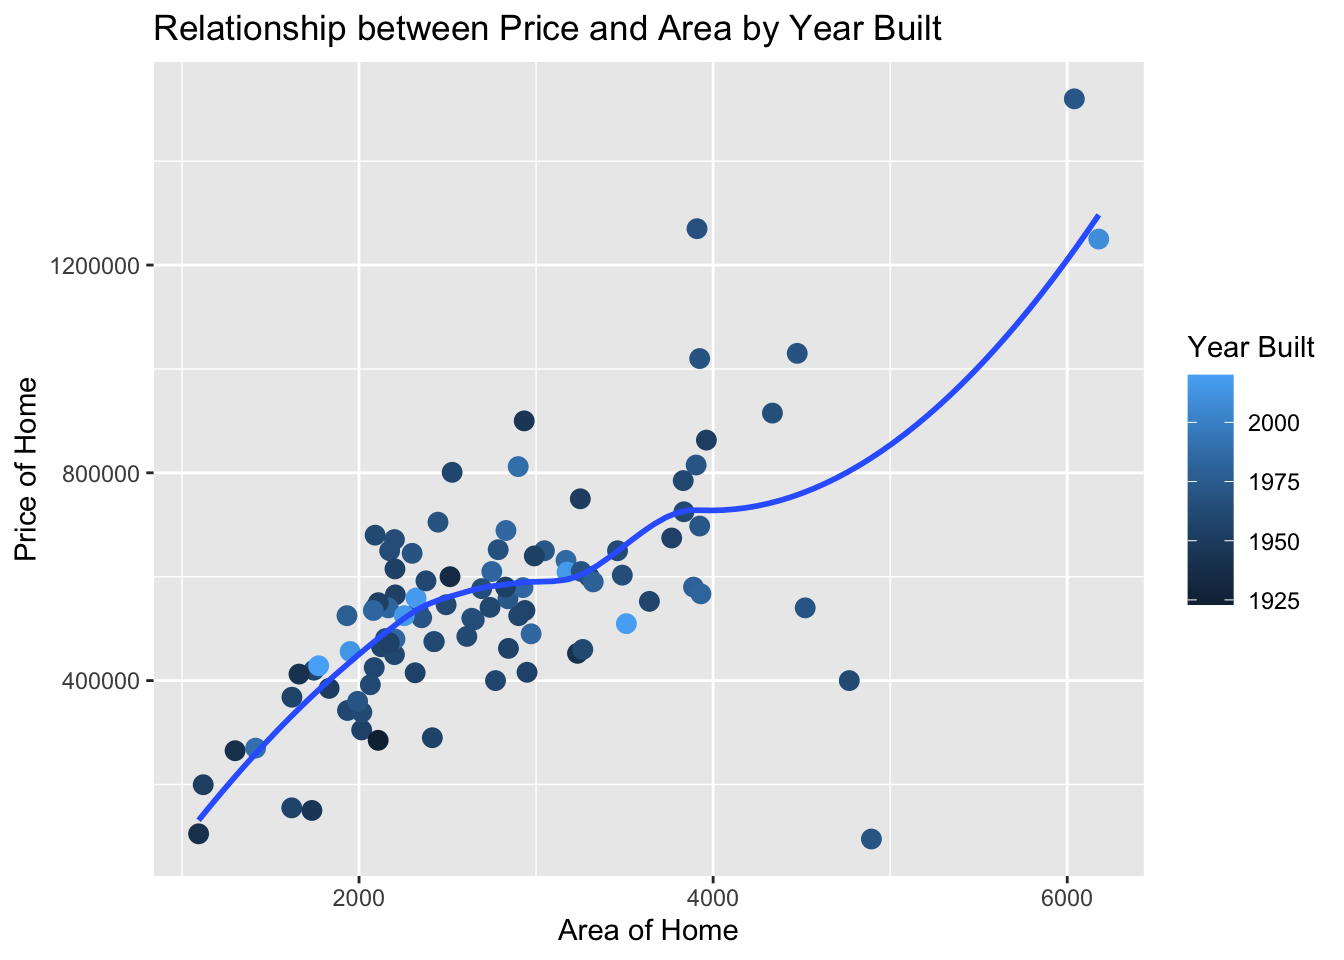
Claim 1: Yes, there seems to be evidence of a positive relationship between the price of the home and the area of the home.
Claim 2: No, there does not seem to be a relationship between the price and age of the home.
Claim 3: No, there does not seem to be any evidence to suggest that larger more expensive homes are newer than those houses that are cheaper and smaller. Points that are lighter colored (newer homes) are not concentrated on the top right of the plot.
Now is a good time to render, commit, and push. Make sure that you commit and push all changed documents and your Git pane is completely empty before proceeding.