Data Importing
Lecture 9
May 28, 2025
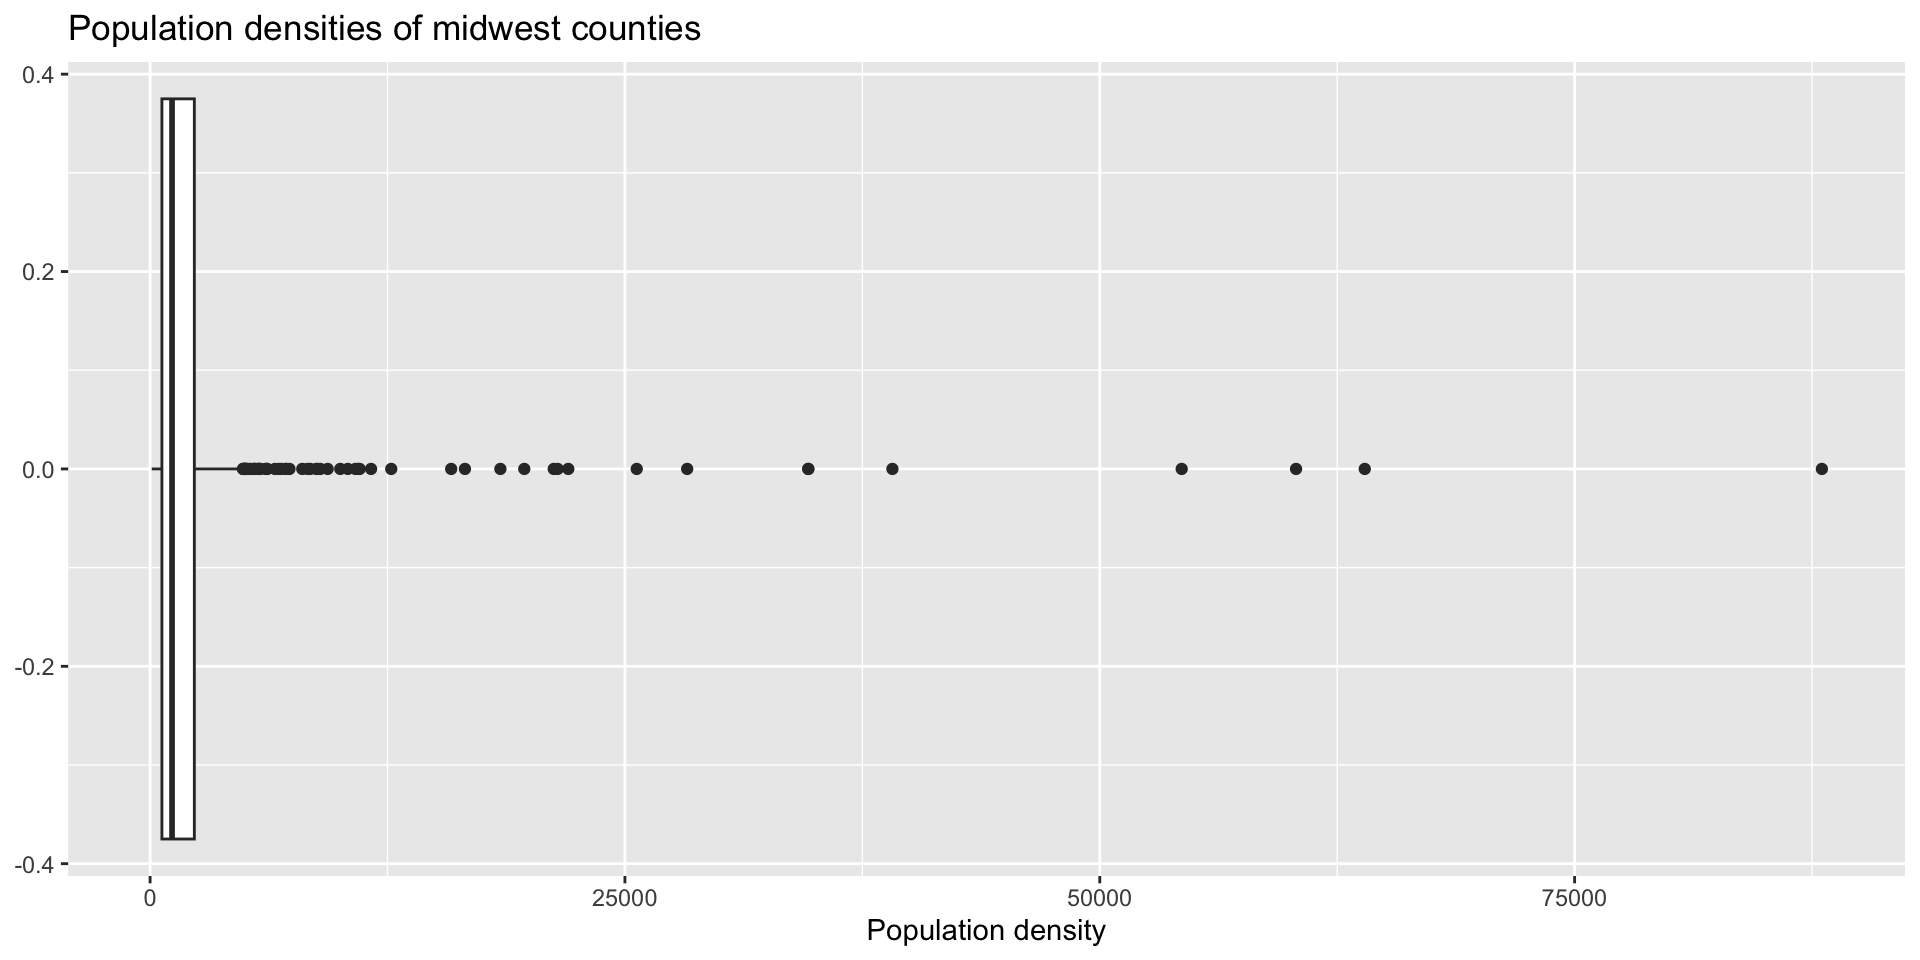
Lab 2 Question 5
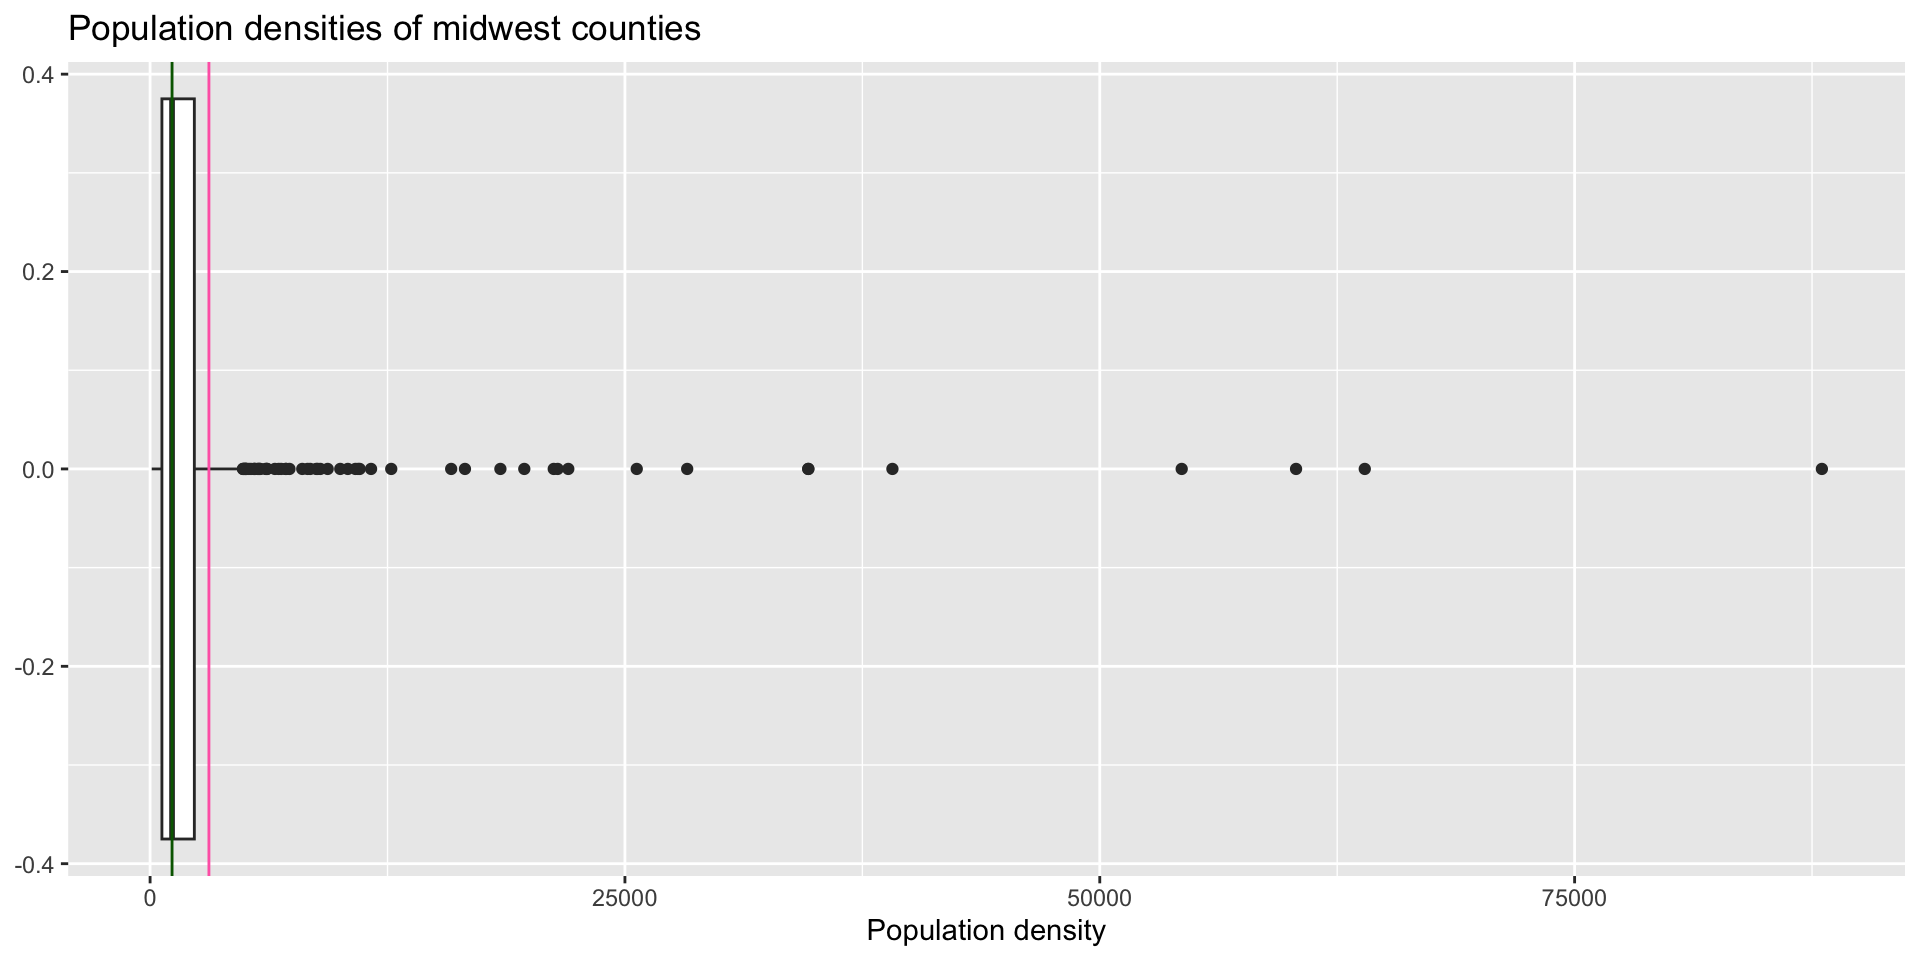
# A tibble: 1 × 2
   mean   med
  <dbl> <dbl>
1 3098. 1156.Data science
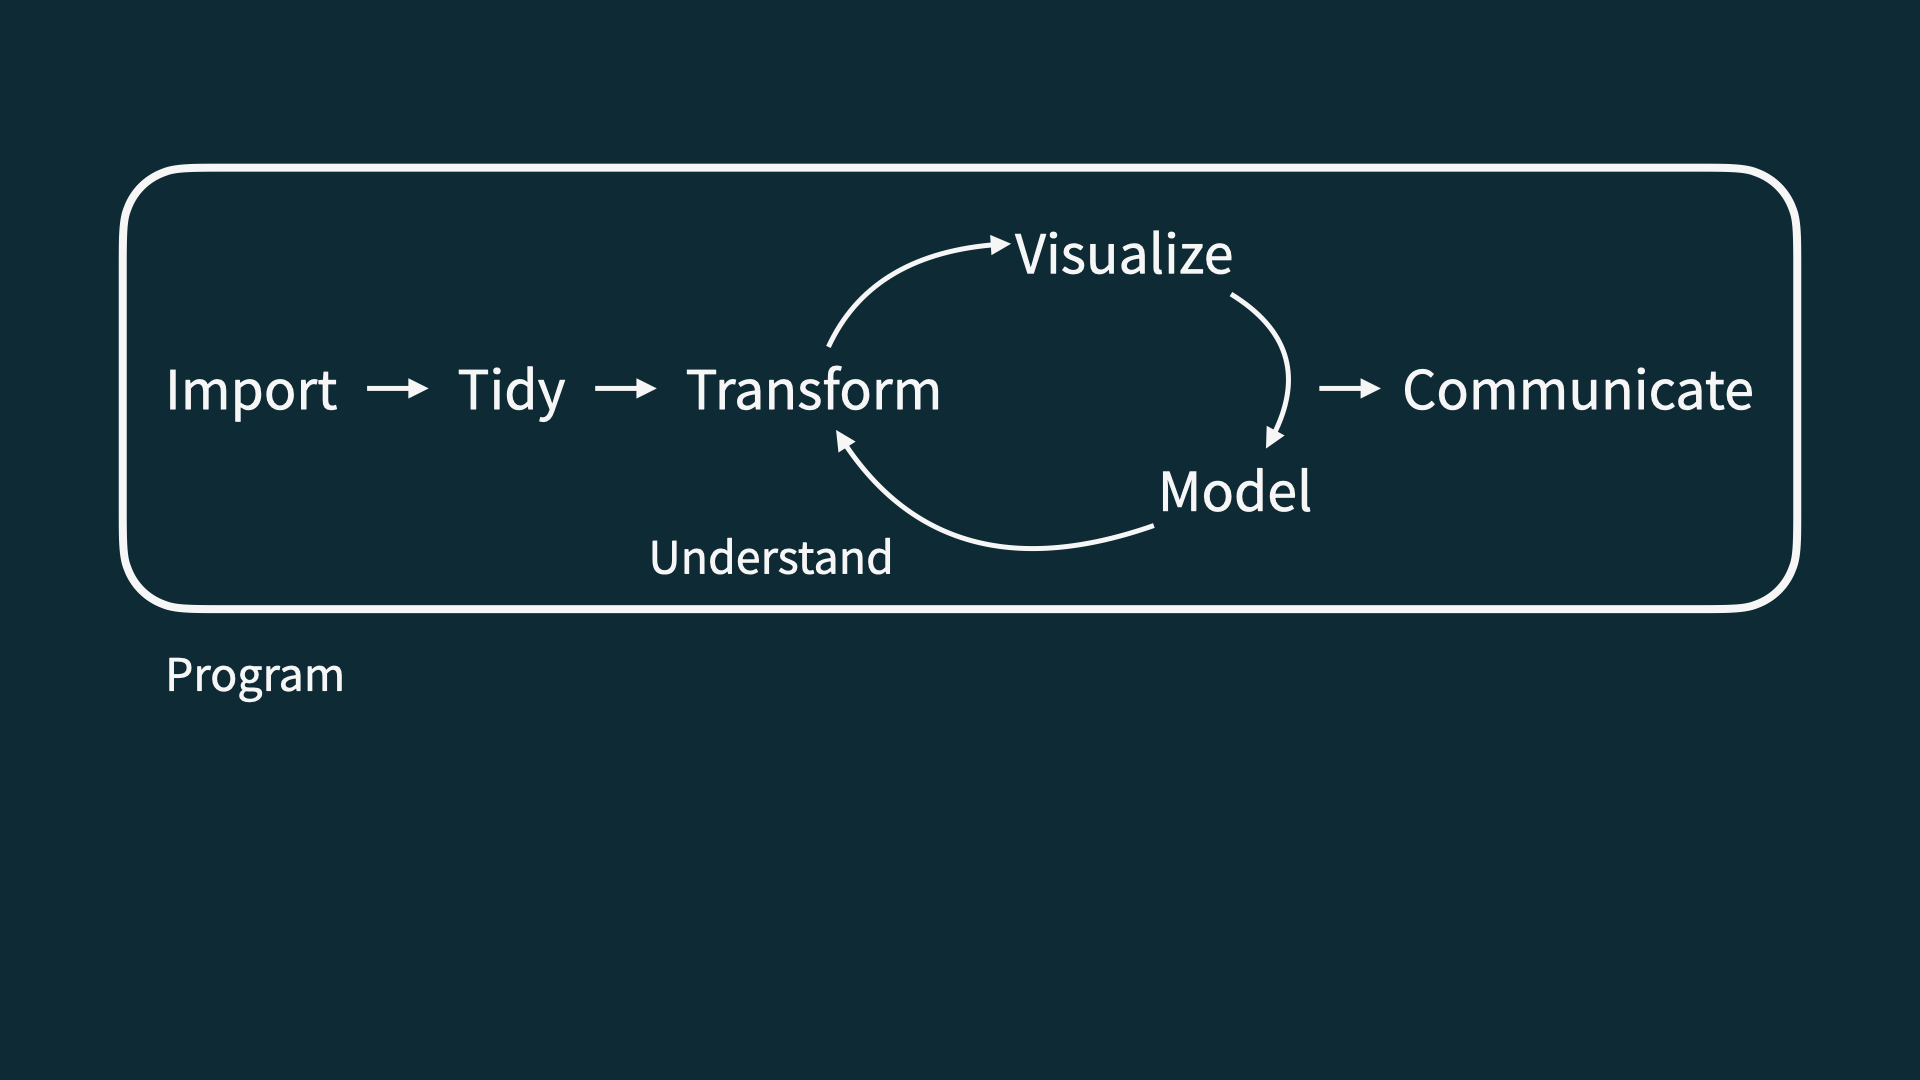
Reading in rectangular data
Path to file
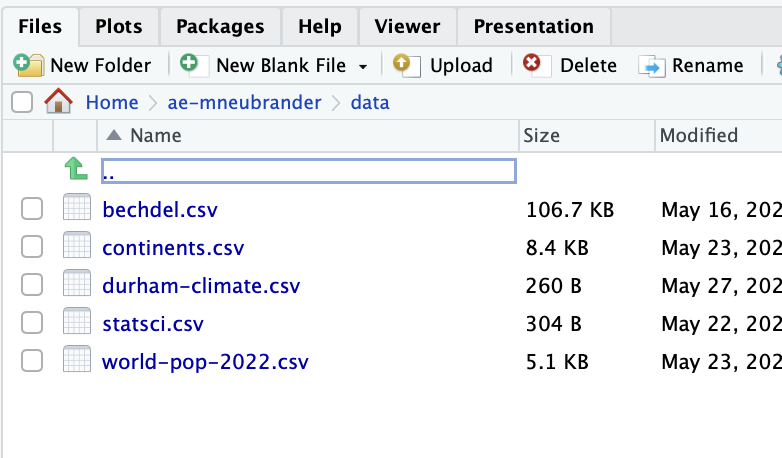
Where is durham-climate.csv?
use
/to separate folder(s) + file names; file path in quotesAnswer:
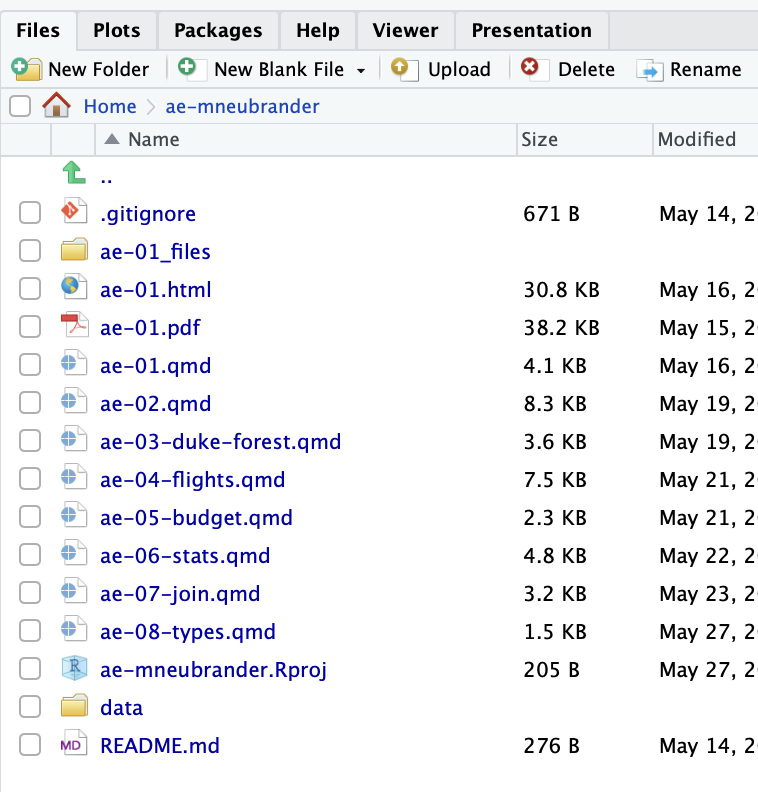
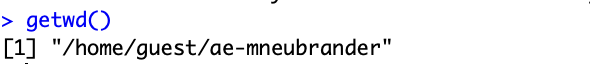
Why not include ae-mneubrander?
Where is durham-climate.csv?
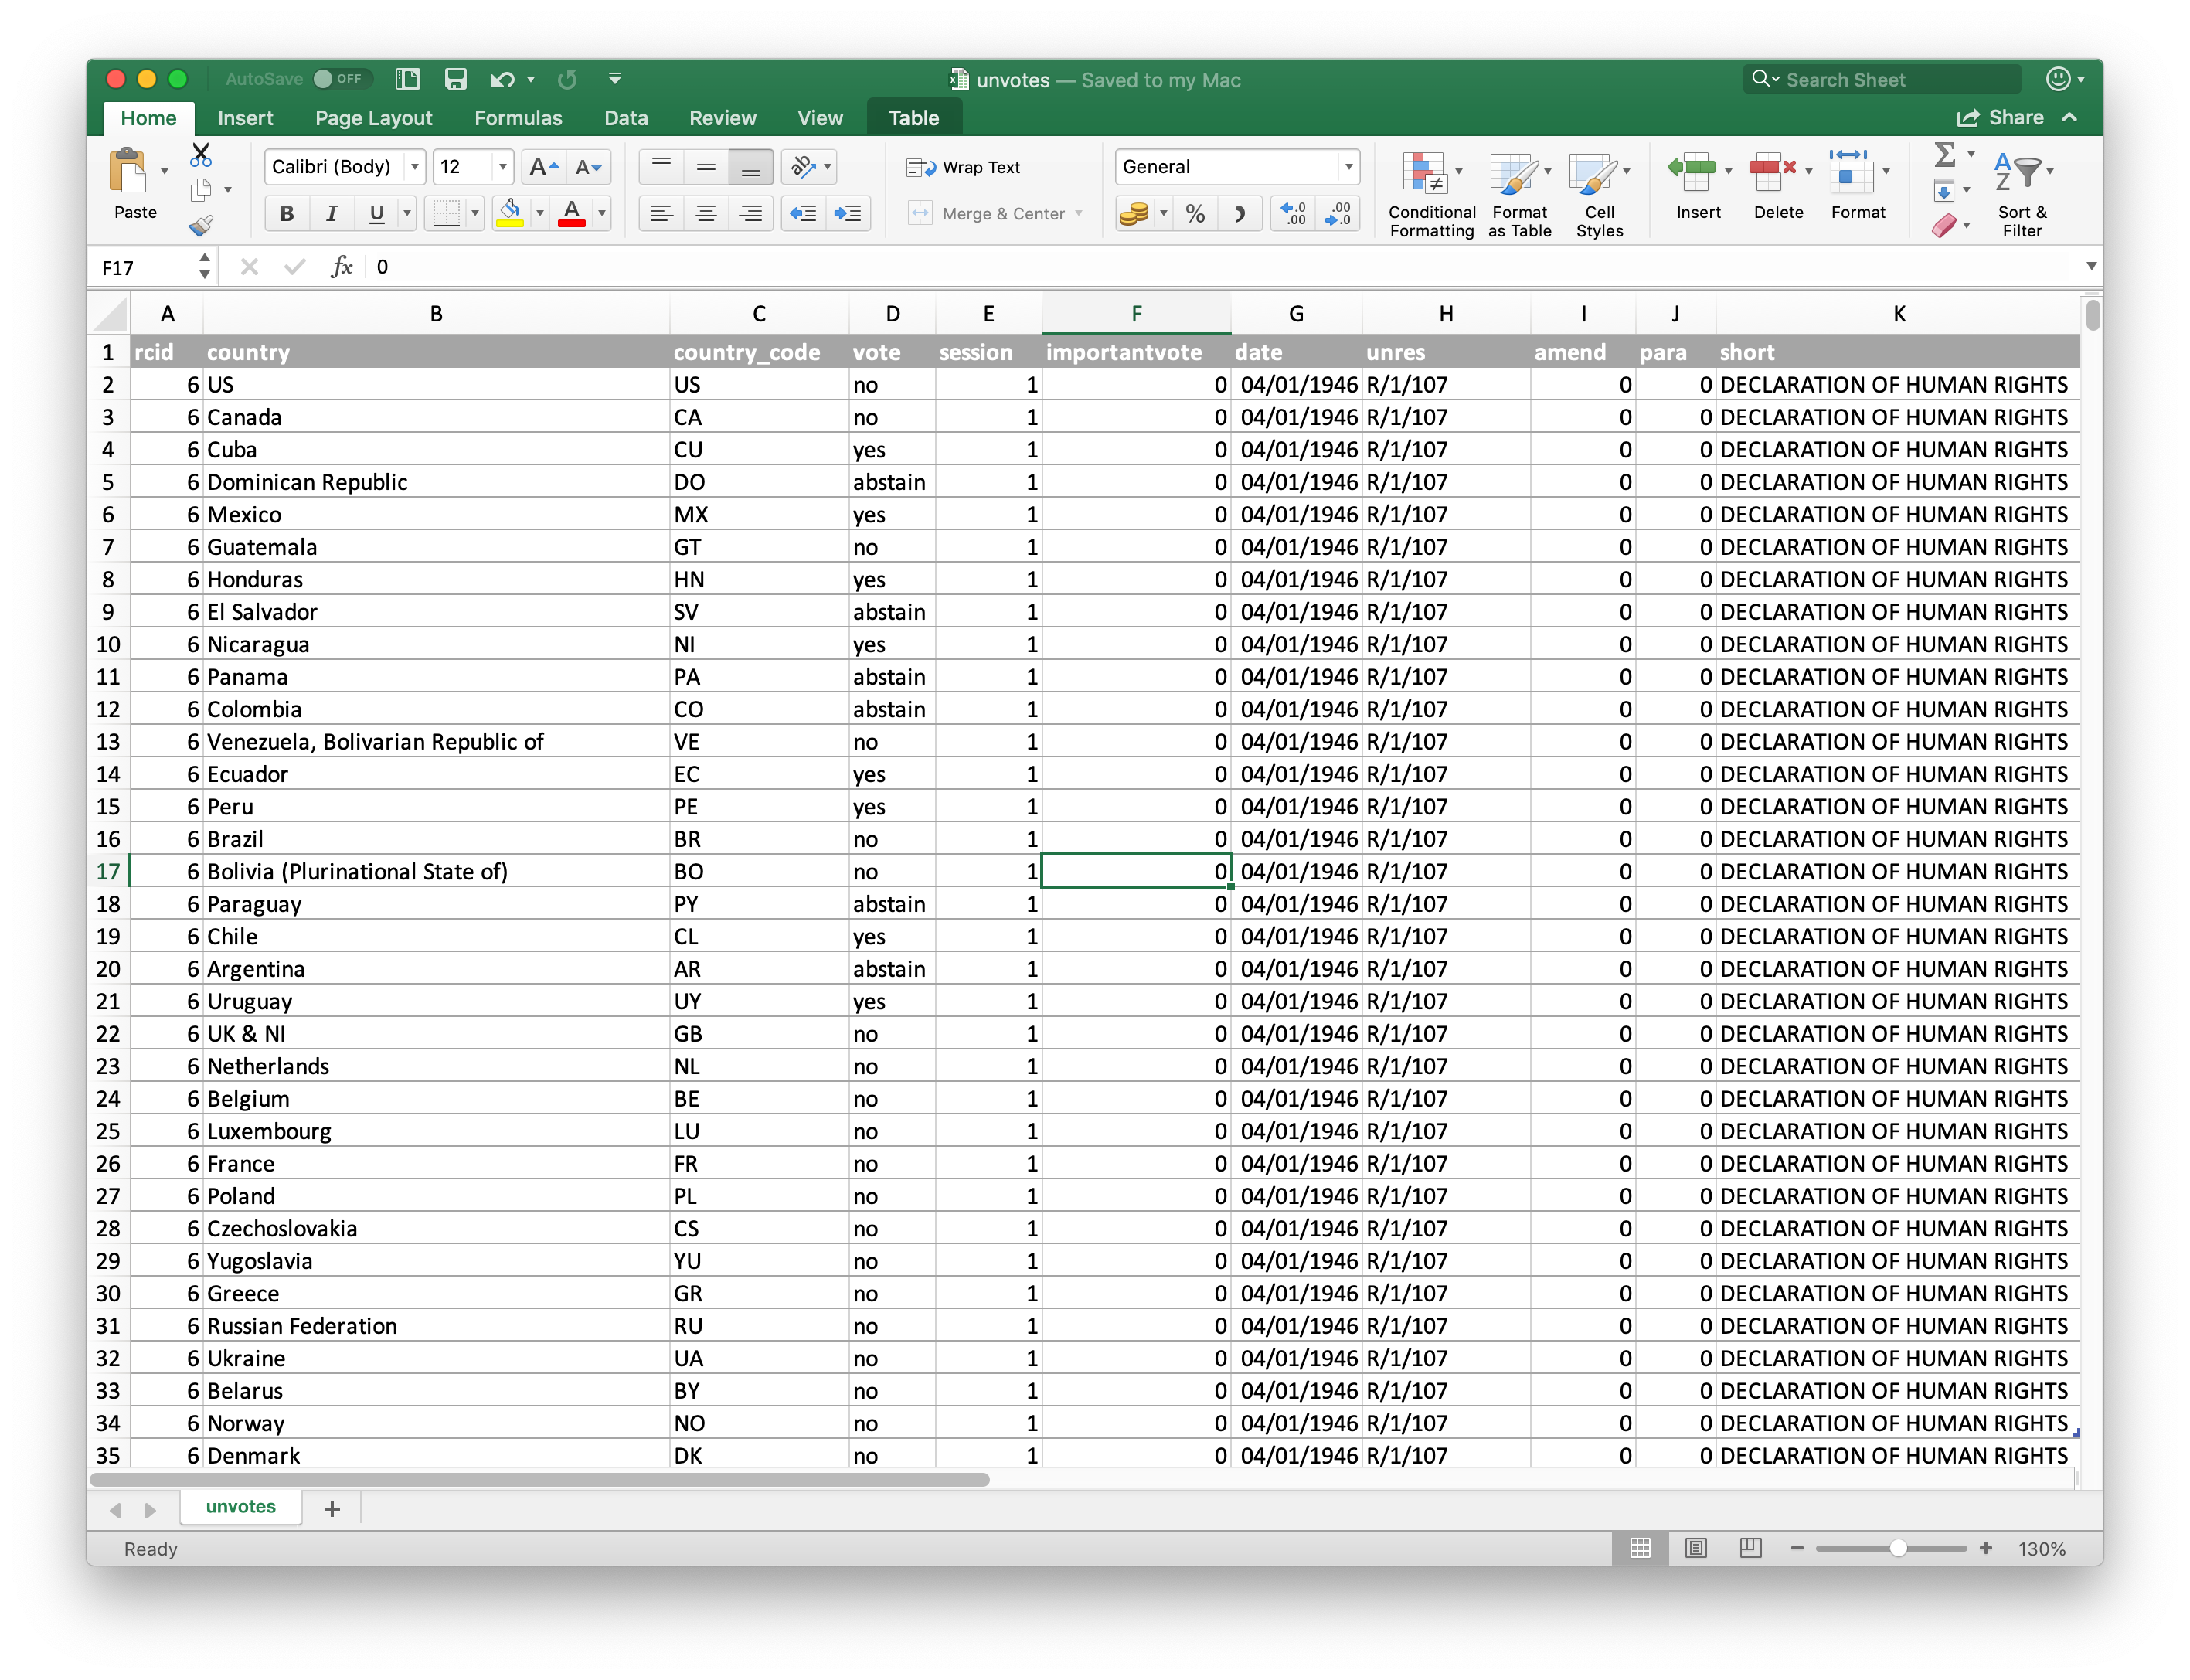
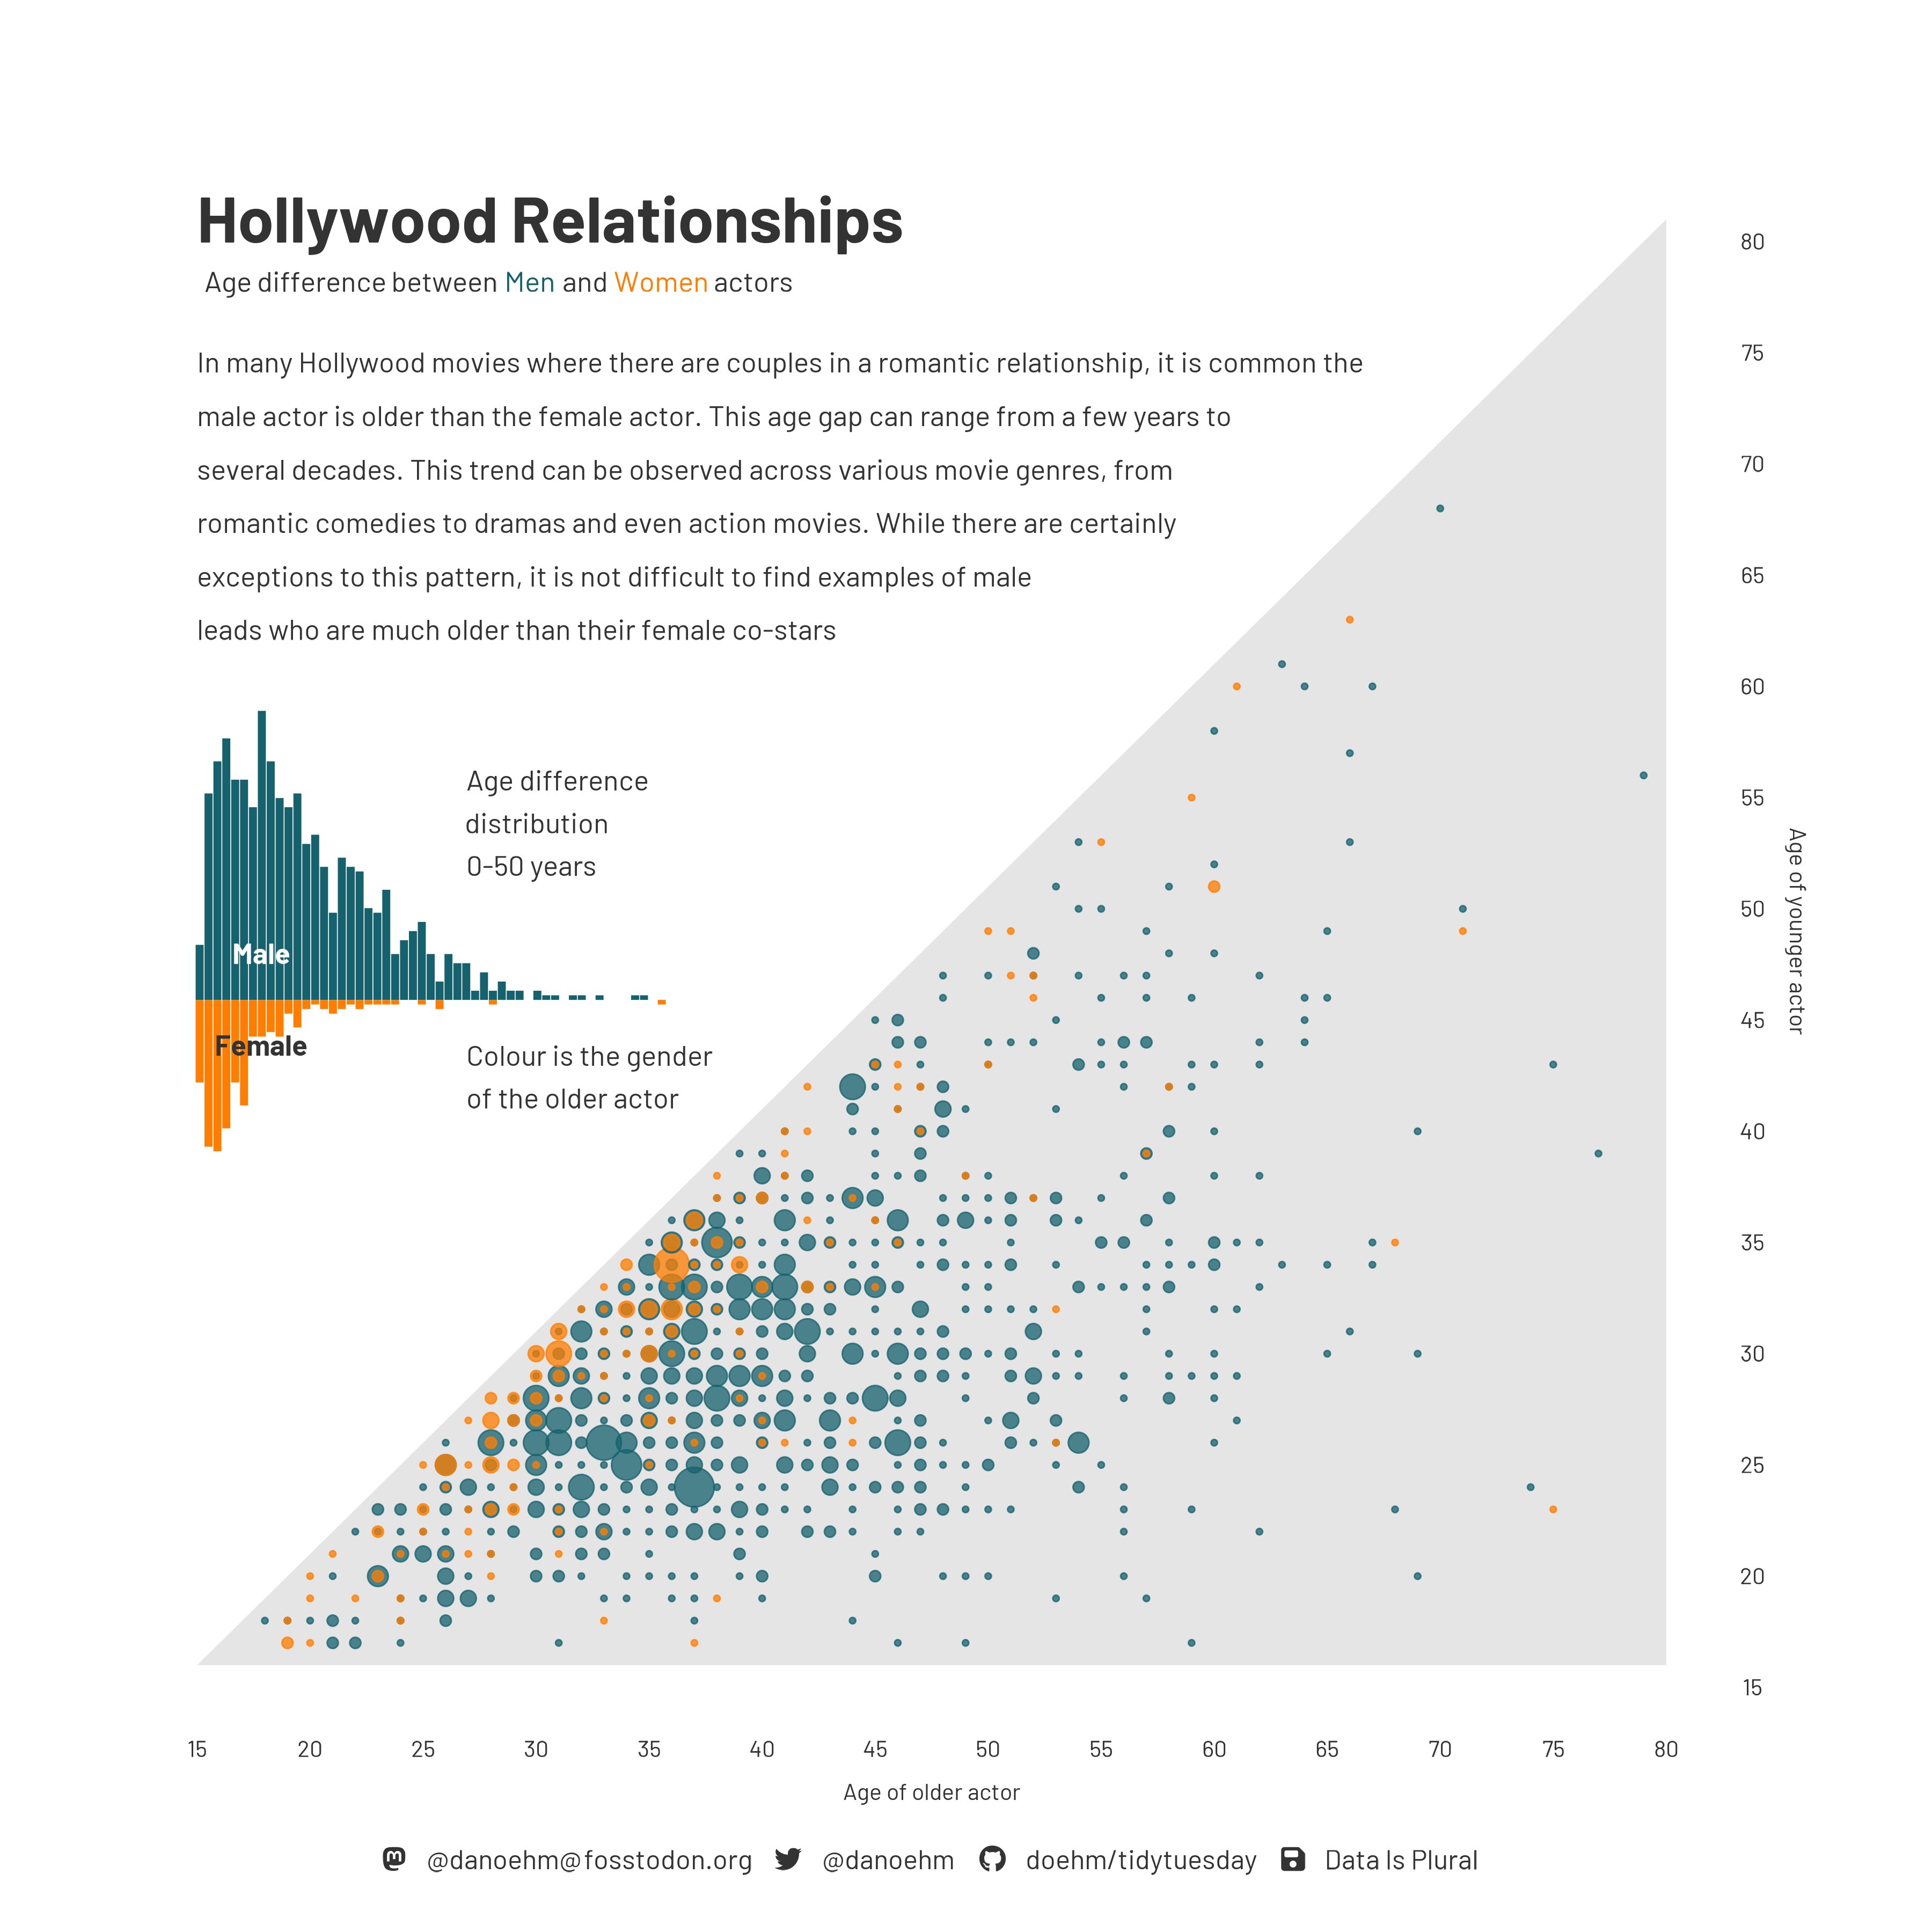
Age gap in Hollywood relationships
Goal 2.2: String Functions
We’ve seen lots of functions that deal with numeric data (mean, median, sum, etc.) - what about characters?
stringr is a tidyverse package with lots of functions for dealing with character strings
today: str_detect in stringr

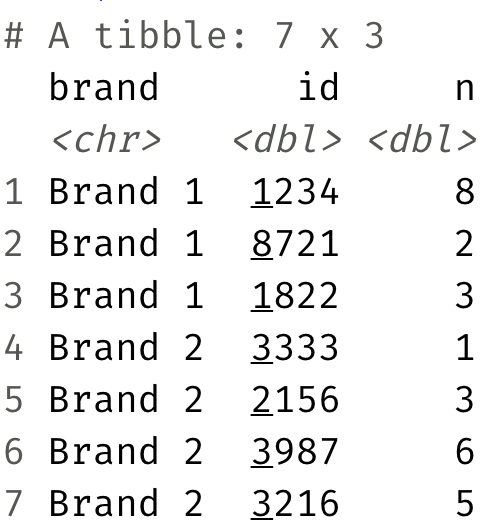
Sales data
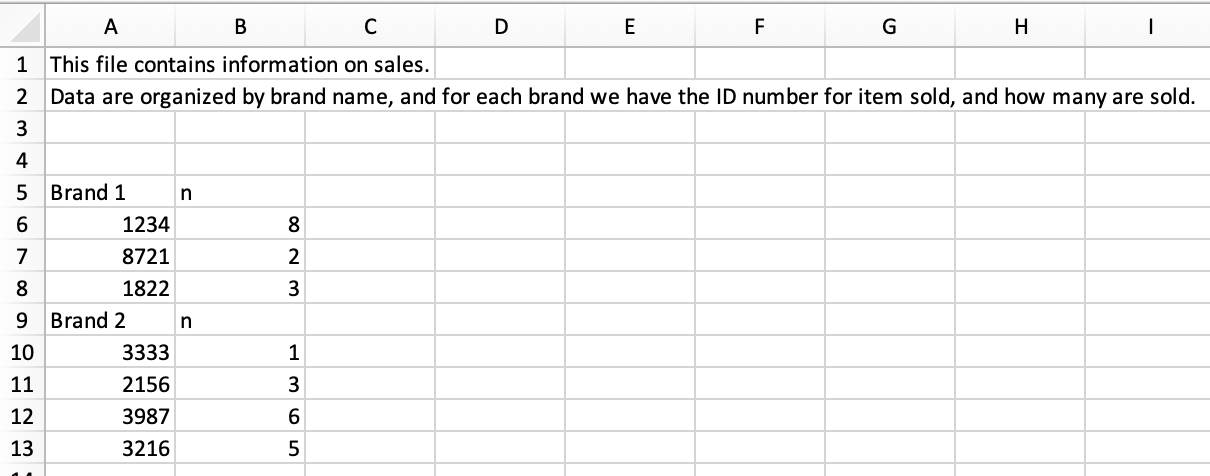
Are these data tidy? Why or why not?
Sales data
What “data moves” do we need to go from the original, non-tidy data to this, tidy one?