Milestone 4
2025-06-16
Announcements
Commit and pushes changes to AE
-
TEAMMATES peer evaluation will open today at noon and close Wednesday at 11:59pm
- Let Marie/Mary know if you are not getting emails from TEAMMATES (check spam folder)
-
Today
Tips to help make project beautiful
Work on project
Review one other team’s project
Code cell options
- We will examine the
echo,warning,eval,fig-width, andfig-aspcode chunk options using the following code:
-
To set code chunk options:
#| option: value– The spaces must be included! Without first space it’s just a comment.Must be at the top of the code chunk or within the YAML at the top of the document (to include the same option for all code chunks)
Try the various options, render the document, and see what happens
Code cell options – echo
echo: Includes the code chunk in the ouptut.
We want this for labs to show our work. We do NOT want this for the project
To include this for the main project file (index.qmd), within yaml at top of document, change
echo: truetoecho: false. Thenechois set tofalsefor ALL code chunks
Code cell options – warning
- warning: Includes warning messages in the output.
Code cell options – eval
eval: Evaluates, or runs, the code.
Can be helpful if you are unable to fix an error before the deadline.
Code cell options – fig-width
fig-width: controls figure width (is a value between 1 and 10)
fig-width: 1on the left,fig-width: 4on the right
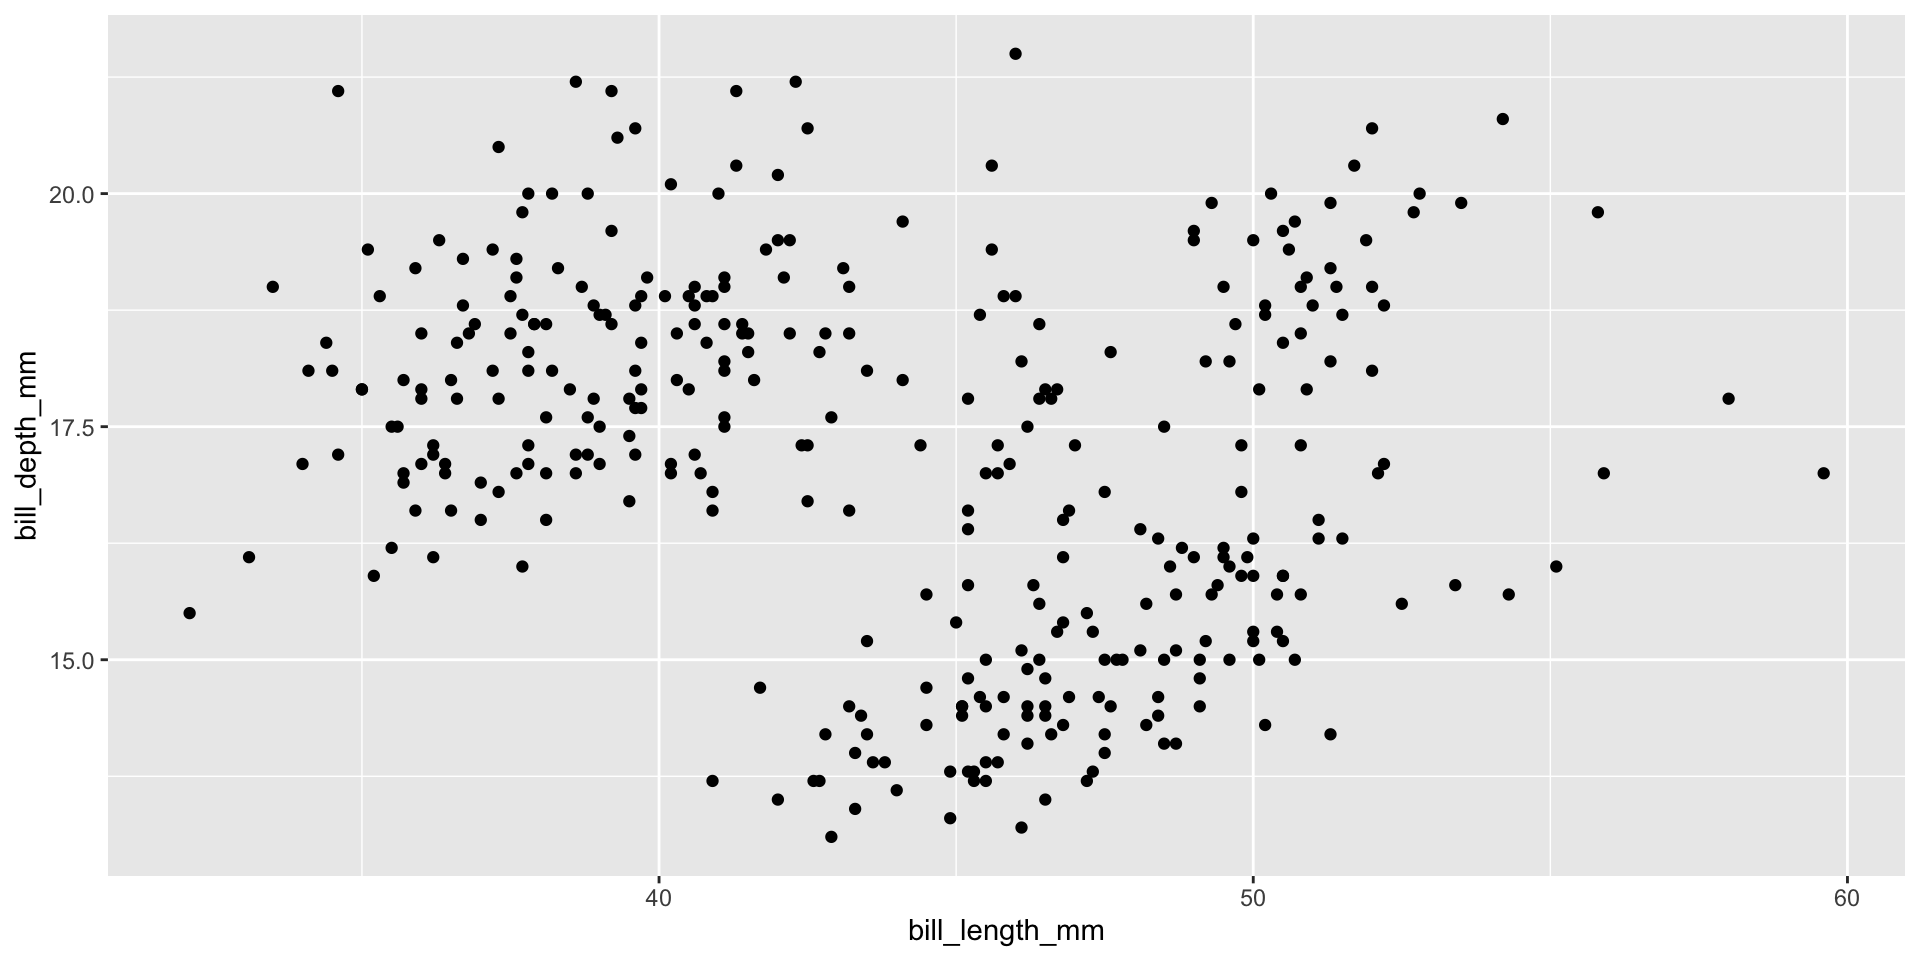
Code cell options – fig-asp
fig-asp: controls figure aspect ratio (is a value between 0 and 1)
fig-asp: 0.1on the left,fig-asp: 0.5in the middle,fig-asp: 1on the right
Tables
- Can create pretty tables using
kable(uses knitr library)